
Official Portal
MASTIC
Ranking and Score: Malaysia and other Selected Countries in Global Innovation Index (GII), 2016-2022
|
|||||||||||||||||||||||||||||||||||||||||||||||||||||||||||||||||||||||||||||||||||||||||||||||||||||||||||||||||||||||||||||||||||||||||||||||||||||||||||||||||||||||||||||||||||||||||||||||||||||||||||||||||||||||||||||||||||||||||||||||||||||||||||||||||||||||||||||||||||||||||||||||||||||||||||||||||||||||||||||||||||||||||||||||||||||
Source: Global Innovation Index | Tracking Innovation through the COVID-19 Crisis
Summary
The table above shows the achievement of several countries in the Global Innovation Index for 2016-2022. Malaysia is categorised as an Upper Middle (UM) income country based on its gross national income (GNI) per capita. In 2022, Malaysia maintained its ranked 36th as the previous year.
Ranking and Score of Selected Countries in the IMD World Competitiveness Yearbook (WCY), 2014-2019
| NO. | COUNTRY | 2019 | 2018 | 2017 | 2016 | 2015 | 2014 | ||||||
| RANK | SCORE | RANK | SCORE | RANK | SCORE | RANK | SCORE | RANK | SCORE | RANK | SCORE | ||
| 1 | Singapore | 1 | 100.00 | 3 | 98.55 | 3 | 99.49 | 4 | 97.65 | 3 | 95.00 | 3 | 91.00 |
| 2 | Hong Kong | 2 | 97.80 | 2 | 99.16 | 1 | 100.00 | 1 | 100.00 | 2 | 96.00 | 4 | 90.30 |
| 3 | USA | 3 | 97.12 | 1 | 100.00 | 4 | 98.66 | 3 | 97.88 | 1 | 100.00 | 1 | 100.00 |
| 4 | Switzerland | 4 | 96.01 | 5 | 97.14 | 2 | 99.66 | 2 | 98.02 | 4 | 91.92 | 2 | 92.42 |
| 5 | Qatar | 10 | 91.95 | 14 | 88.89 | 17 | 88.10 | 13 | 86.72 | 13 | 84.60 | 19 | 77.10 |
| 6 | China | 14 | 88.78 | 13 | 89.03 | 18 | 87.76 | 25 | 79.35 | 22 | 77.00 | 23 | 73.30 |
| 7 | Taiwan | 16 | 88.24 | 17 | 87.91 | 14 | 90.48 | 14 | 86.37 | 11 | 85.40 | 13 | 81.20 |
| 8 | Germany | 17 | 85.74 | 15 | 88.75 | 13 | 91.59 | 12 | 88.57 | 10 | 85.60 | 6 | 85.80 |
| 9 | Australia | 18 | 85.51 | 19 | 87.06 | 21 | 85.25 | 17 | 84.27 | 18 | 80.50 | 17 | 79.60 |
| 10 | Malaysia | 22 | 82.54 | 22 | 85.17 | 24 | 83.53 | 19 | 83.05 | 14 | 84.10 | 12 | 82.10 |
| 11 | UK | 23 | 81.84 | 20 | 85.62 | 19 | 86.78 | 18 | 83.34 | 19 | 79.90 | 16 | 79.80 |
| 12 | Thailand | 25 | 77.23 | 30 | 79.45 | 27 | 80.10 | 28 | 74.68 | 30 | 69.80 | 29 | 65.00 |
| 13 | Korea | 28 | 76.50 | 27 | 80.12 | 29 | 78.65 | 29 | 74.20 | 25 | 73.90 | 26 | 69.70 |
| 14 | Japan | 30 | 74.63 | 25 | 81.31 | 26 | 82.27 | 26 | 78.72 | 27 | 72.80 | 21 | 73.80 |
| 15 | India | 43 | 67.29 | 44 | 68.77 | 45 | 69.70 | 41 | 65.83 | 44 | 59.50 | 44 | 53.90 |
| 16 | Philippines | 46 | 64.73 | 50 | 64.66 | 41 | 71.80 | 42 | 65.54 | 41 | 60.20 | 42 | 55.00 |
Note: Number of participating countries:63 countries (2019, 2018 & 2017); 61 countries (2016 & 2015); 60 countries (2014)
Summary
The table above shows the position of Malaysia compared to other selected countries in the IMD World Competitiveness Yearbook (WCY) during 2014-2019. Malaysia remains at 22nd position in 2019 compared to last year, but the score drop 2.63 points to 82.54 . Malaysia Productivity Corporation (MPC) is the Partner Institute for this report and MESTECC is one of data contributor (Pillar: Basic Infrastructure and Scientific Infrastructure ).
Framework of The Global Innovation Index (GII), 2022
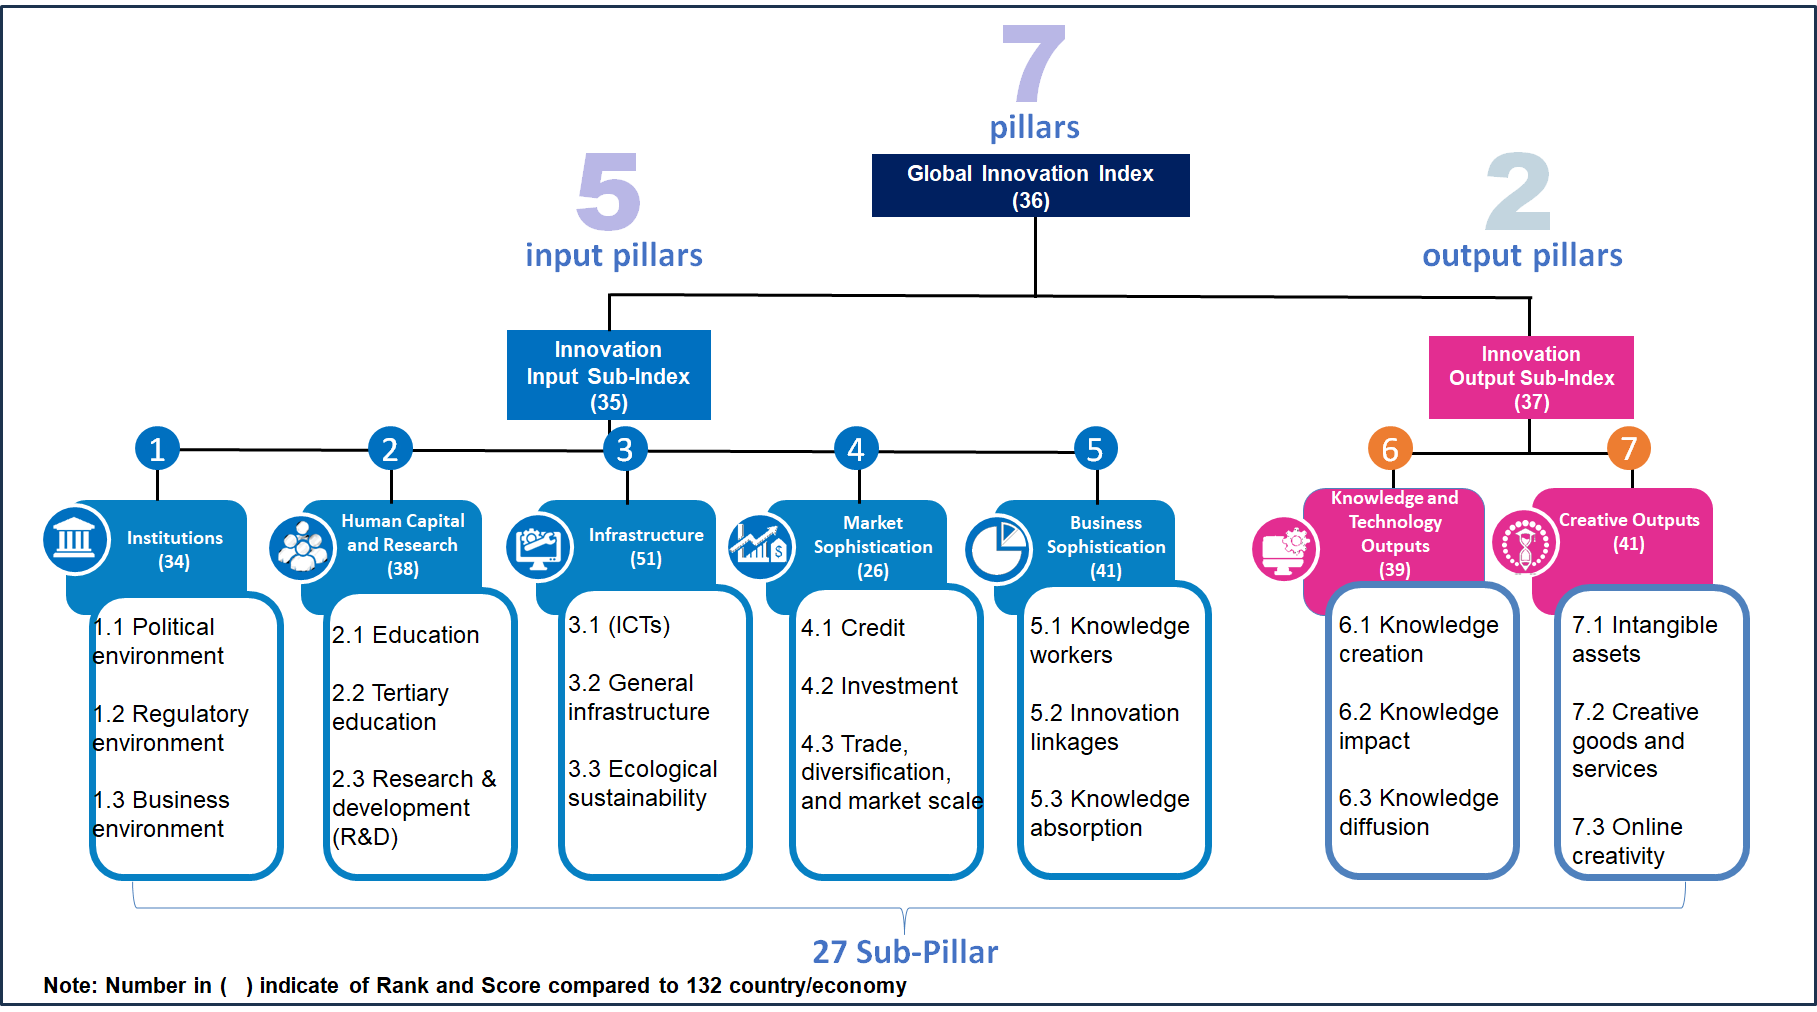
Summary
The chart above shows the position of Malaysia in all criteria measured in the Global Innovation Index (GII) in 2022. In 2022, Malaysia has maintained its ranked 36th out of 132 countries as the previous year. For the innovation input sub-index, Malaysia was ranked 35th and ranked 37th for the innovation output sub-index.
Summary
The graph above shows a comparison of gross expenditure on R&D (GERD) as compared to the Gross Domestic Product (GDP) for selected countries. The WCY 2019 report shows that Malaysia was ranked 24th out of 63 countries, remains at the same positions as compared to last year with GERD/ GDP value of 1.44 .
Summary
The graph above shows the Business Expenditure on R&D (BERD) relatives to GDP. WCY 2019 reported that Malaysia moved up 2 spot to 26th position out of 63 countries compared to previous performance with BERD / GDP ratio of 0.81%.
Summary
The graph shows a comparison on Full Time Equivalent (FTE) of R&D personnel for selected countries. FTE indicate the period of time used by R&D personnel to conduct R&D activities. In 2019 report, the FTE of Malaysia was 89.2 thousand and moved up 1 spot to be ranked at 20th out of 63 countries.