
Official Portal
MASTIC
Global Innovation Index : The Malaysia Chapter
Announcment!


GII Inforgraphic

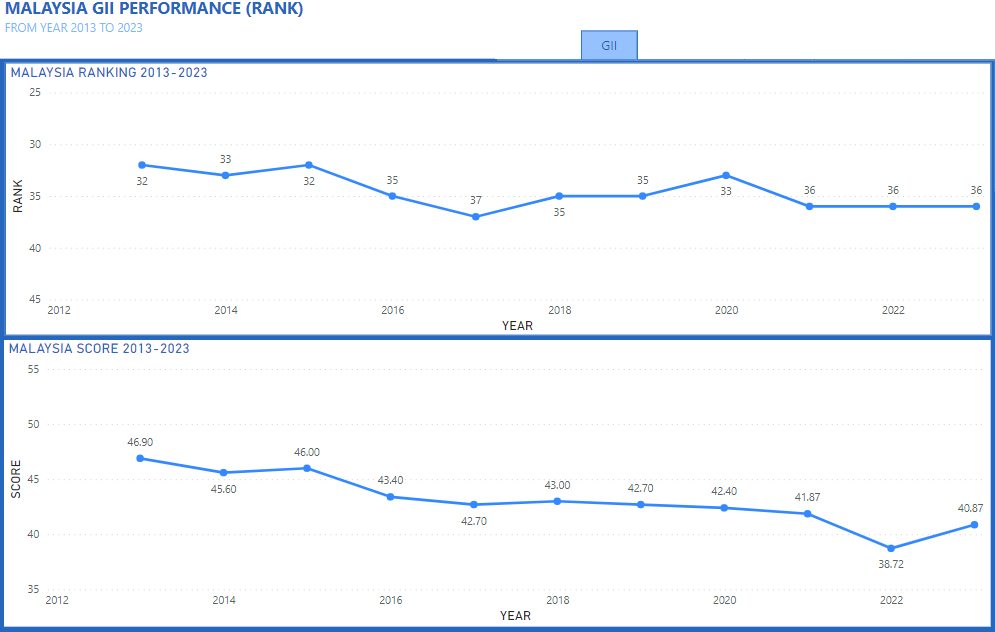
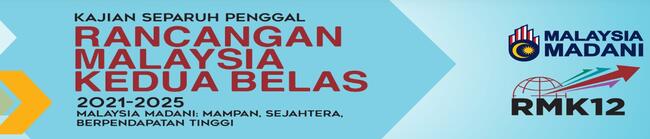
"KUALA LUMPUR, 11th September 2023 - Prime Minister Datuk Seri Anuar Ibrahim also know as PMX today presented the Mid-Term Review (MTR) of the 12th Malaysia Plan (12MP) at the Dewan Rakyat. The theme of the review is 'Malaysia Madani: Sustainable, Prosperous, High-Income,'. PMX has set a new Global Innovation Index (GII) target for Malaysia to rank 30th out of 132 economies by 2025.
Source : https://mastic.mosti.gov.my
The 12MP or RMKe-12
The 12MP or RMKe-12
The Twelfth Malaysia Plan otherwise known as the 12th Malaysia Plan and abbreviated as "12MP" or (Malay: Rancangan Malaysia Kedua Belas - RMke-12), is a comprehensive blueprint prepared by the Economic Planning Unit (EPU) of the Prime Minister's Department (PMO) and the Ministry of Finance. You can find more information about the GII in 12MP here specifically in [p.342, p.348, p.387, p.388 & p.391].
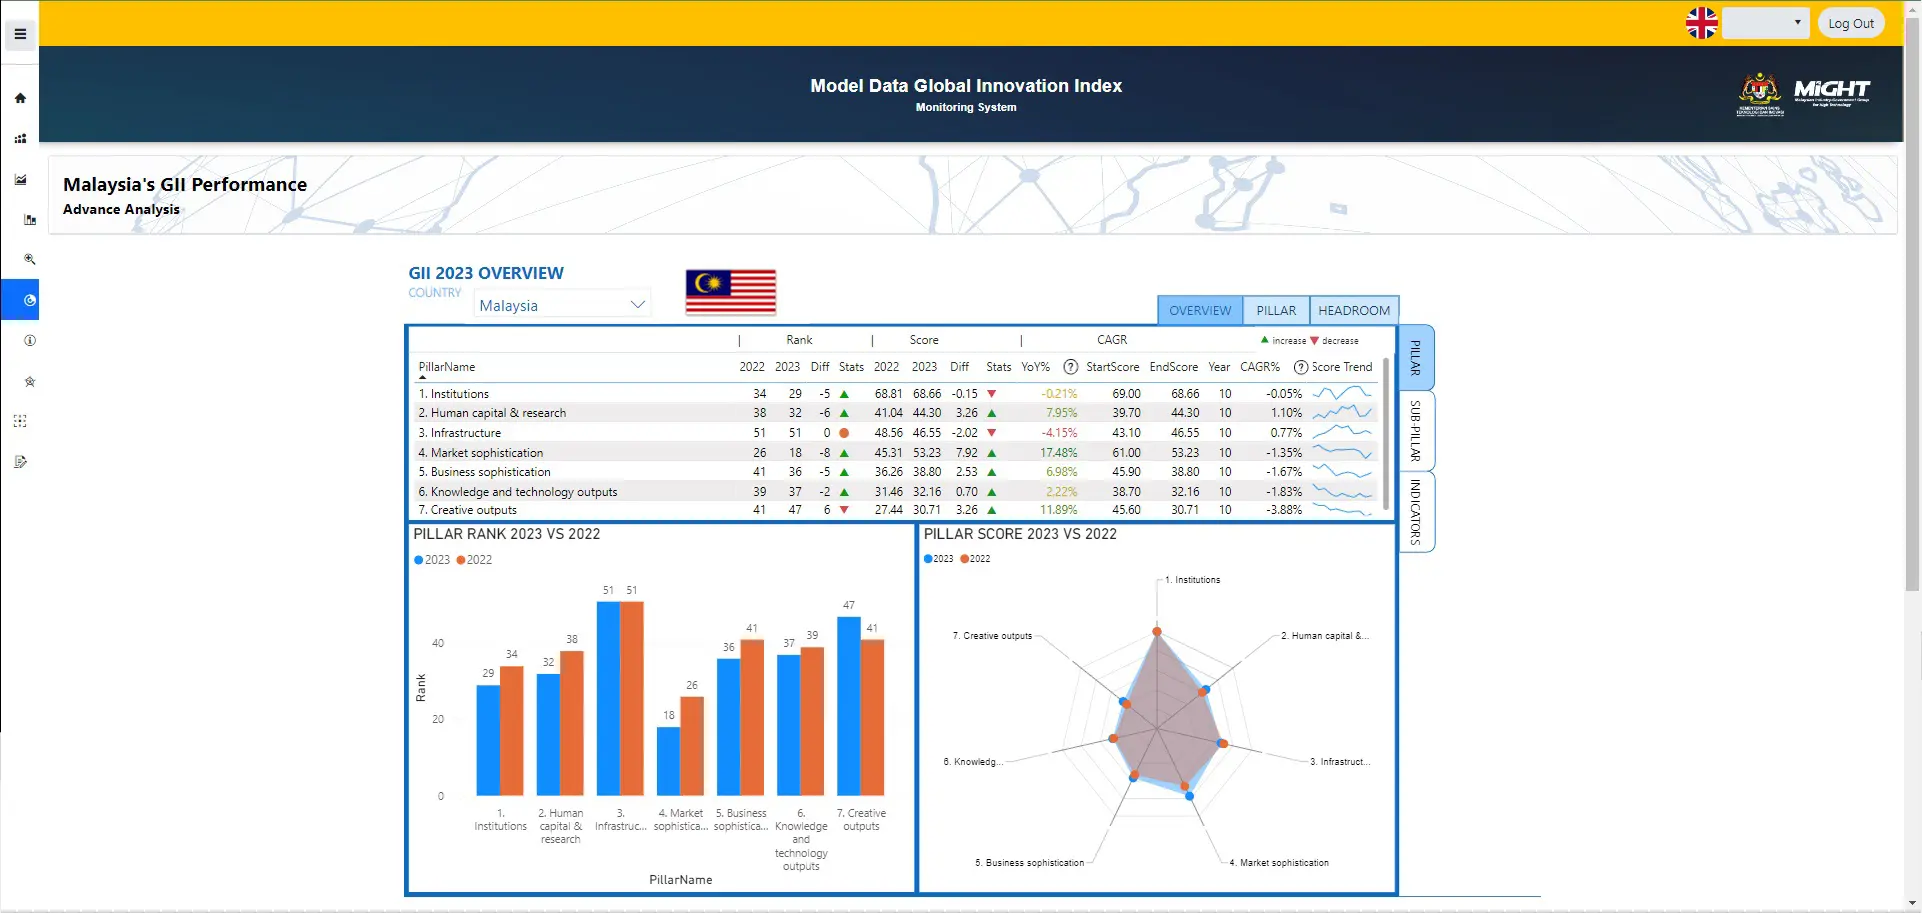
GII Monitoring System also known as "Model Data Global Innovation Index"
GII Monitoring System also known as "Model Data Global Innovation Index"
The Global Innovation Index (GII) monitoring system called as "Model Data Global Innovation Index" is a tool that was specifically developed to track Malaysia’s GII scores & ranking from the past year since 1996 to the next foresight year ahead. The system is managed by MASTIC-MOSTI and MIGHT (Strategic Partner) in the Jawatankuasa Inter-Agensi Pemantauan Daya Saing GII (JIPGII), which is a committee established by the Ministry of Science, Technology and Innovation (MOSTI). The purpose of the system is to monitor Malaysia’s past performance, country benchmarking, details of indicator information, simulation of data/scenarios that have the potential to predict and subsequently improve the country’s position, and tracking to track the year used for each indicator for Malaysia and to compare/monitor targets and actual data from time to time. You can find more information about the Portal called System Model Data GII HERE.
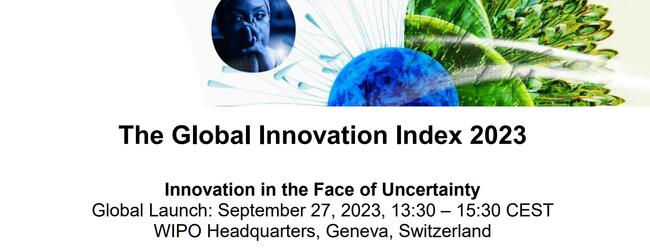
Top 10: The World’s Most Innovative Countries – Global Innovation Index 2023.
In the Global Innovation Index for 2023, Switzerland remains at the forefront, securing the 1st position for the 13th consecutive year. Sweden holds steady in 2nd place, while the United States slips to 3rd from its 2nd-place ranking in 2022. The United Kingdom maintains its 4th position, while Singapore climbs from 7th to 5th place. Finland drops to 6th, and the Netherlands moves to 7th from 5th. Germany retains 8th place, Denmark rises from 10th to 9th, and the Republic of Korea falls to 10th from 6th in the previous year. In summary, Switzerland, Sweden, and the United States remain innovation leaders, but there have been notable shifts in rankings, with Singapore and the Republic of Korea experiencing significant changes.
Source : www.wipo.int
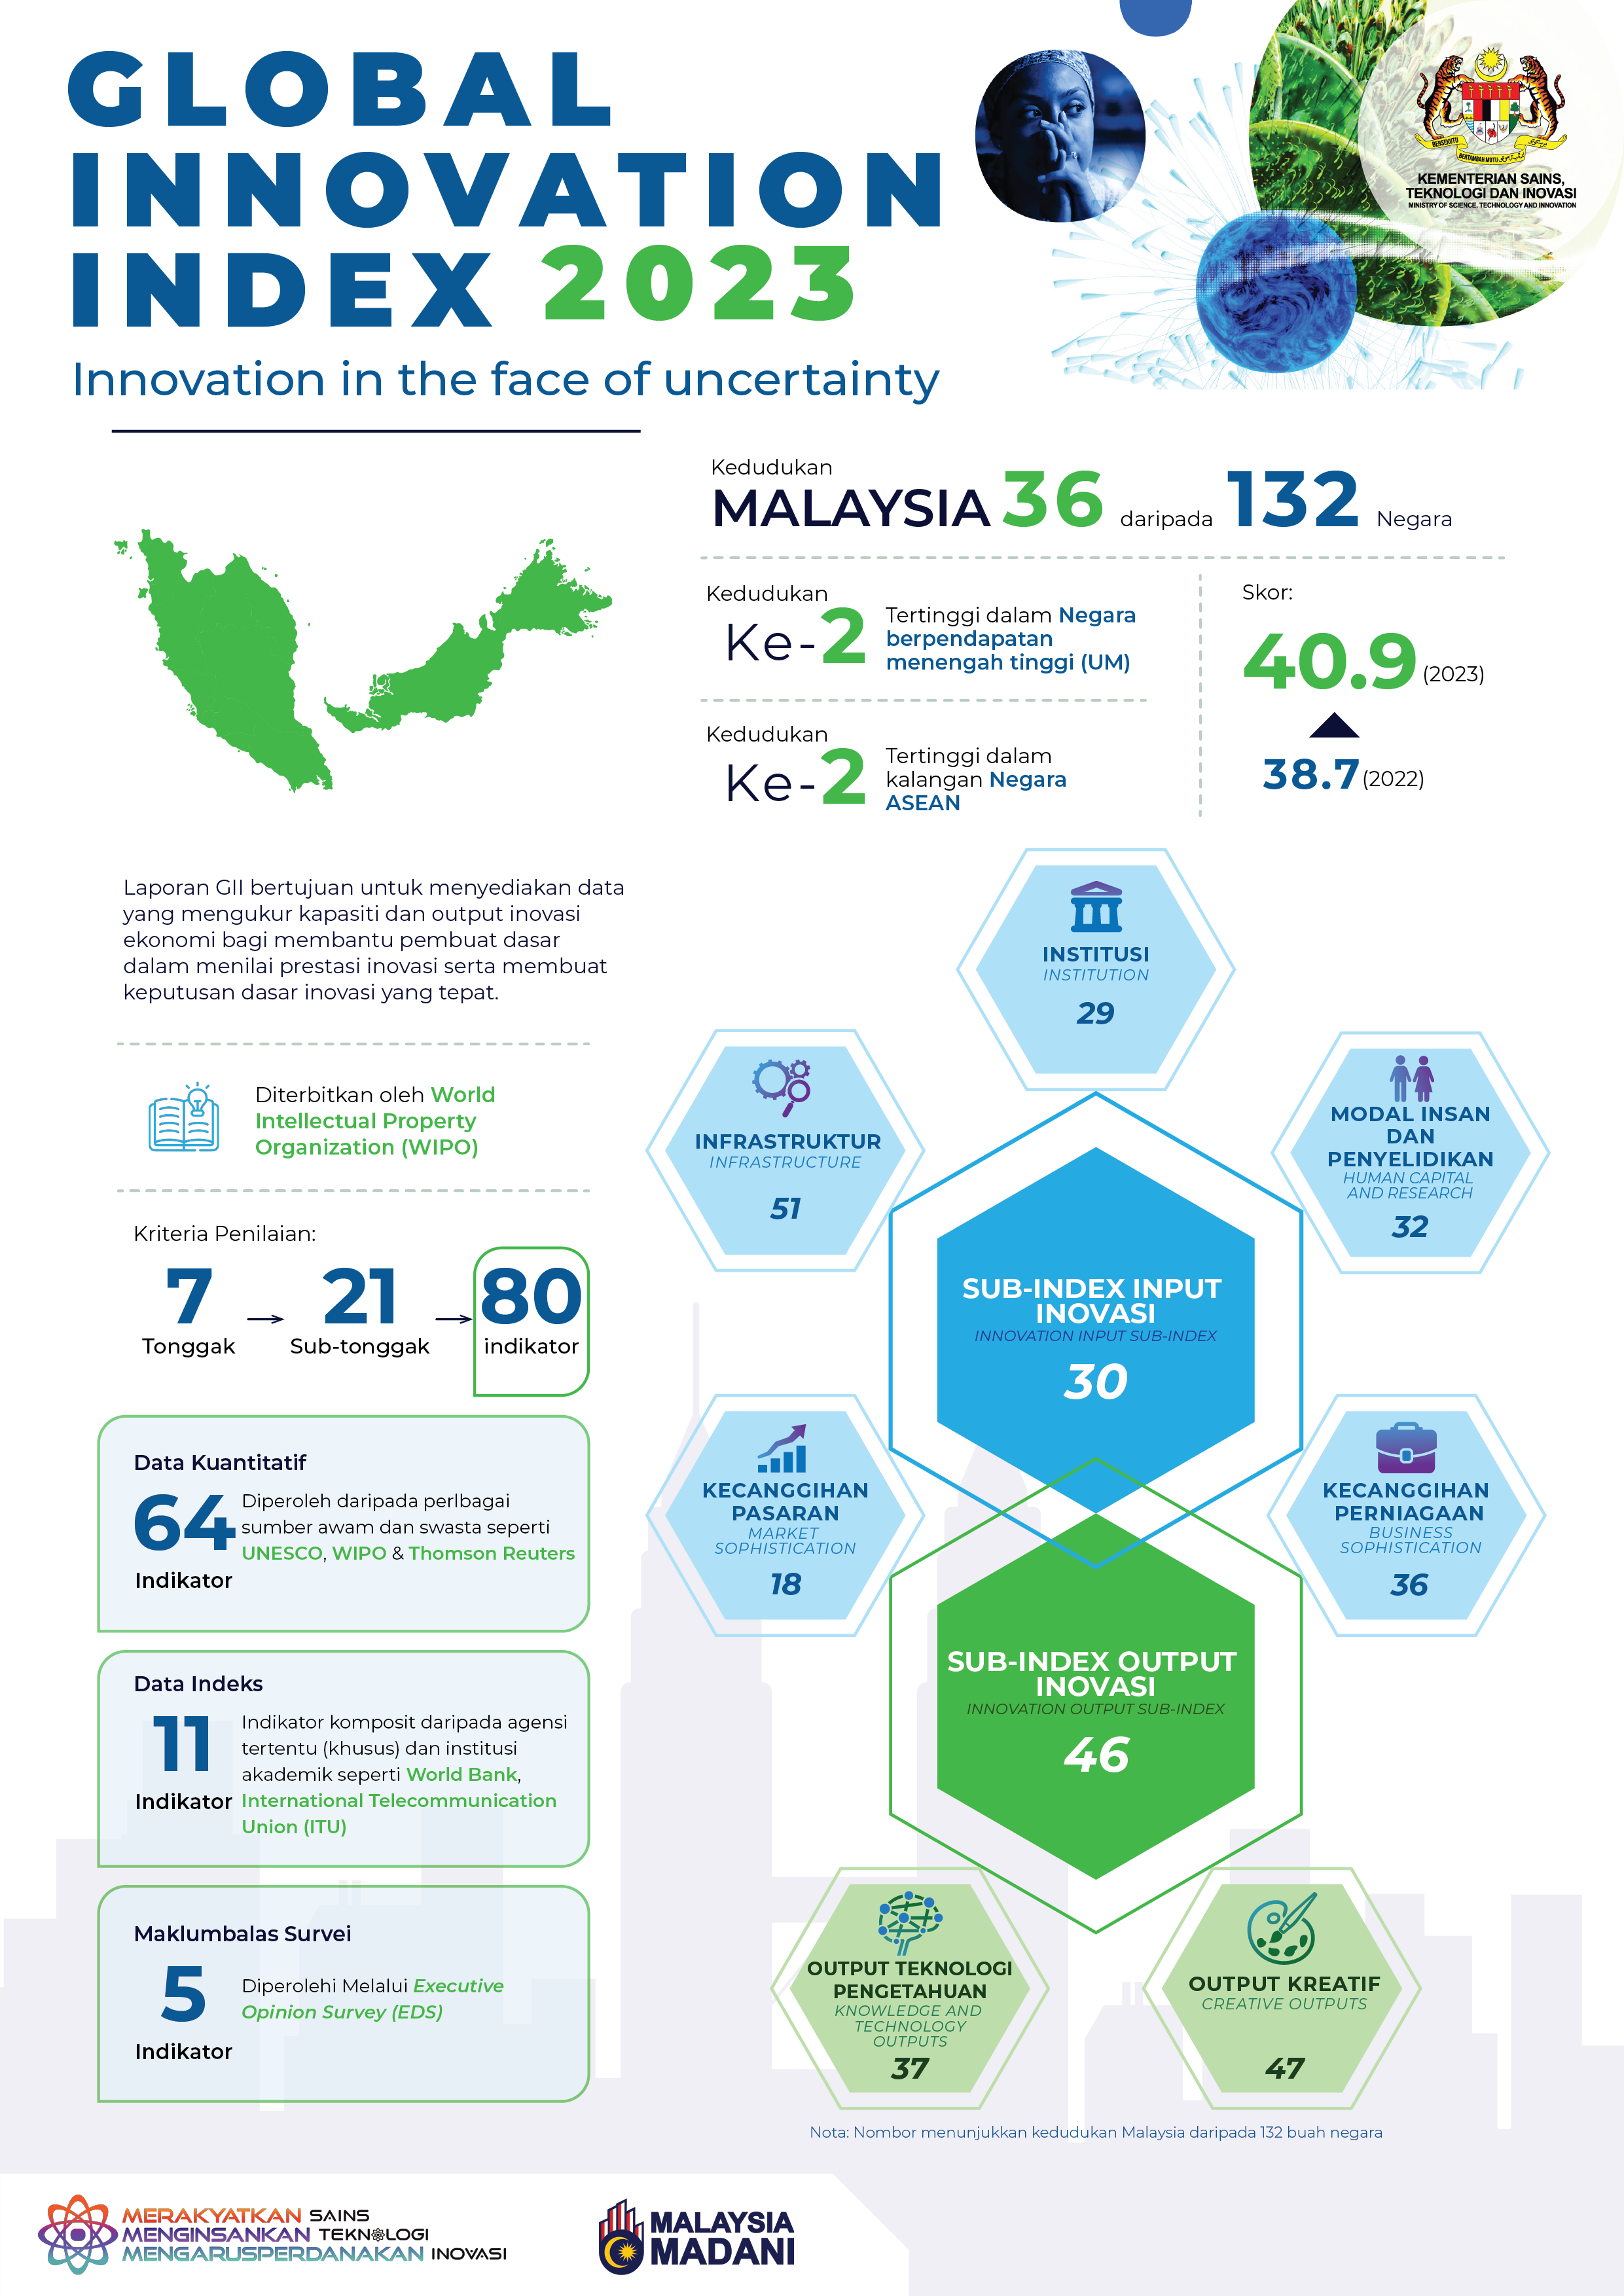
Each of the five (5) input and two (2) output pillars is divided into three sub-pillars, each of which is composed of individual indicators – a total of 81 this year (see the Economy profiles section for the Framework of the Global Innovation Index 2022).
A detailed elaboration of the conceptual framework and pillars can be found in the 2020 edition of the GII. Each sub-pillar is calculated by taking the weighted average of its individual indicators’ scores, which are normalized to again produce scores between 0 and 100.
Pillar scores are calculated using the weighted average of each pillar’s sub-pillar scores.
Hence, three indices are calculated:
Definitions of the pillars and what they evaluate:
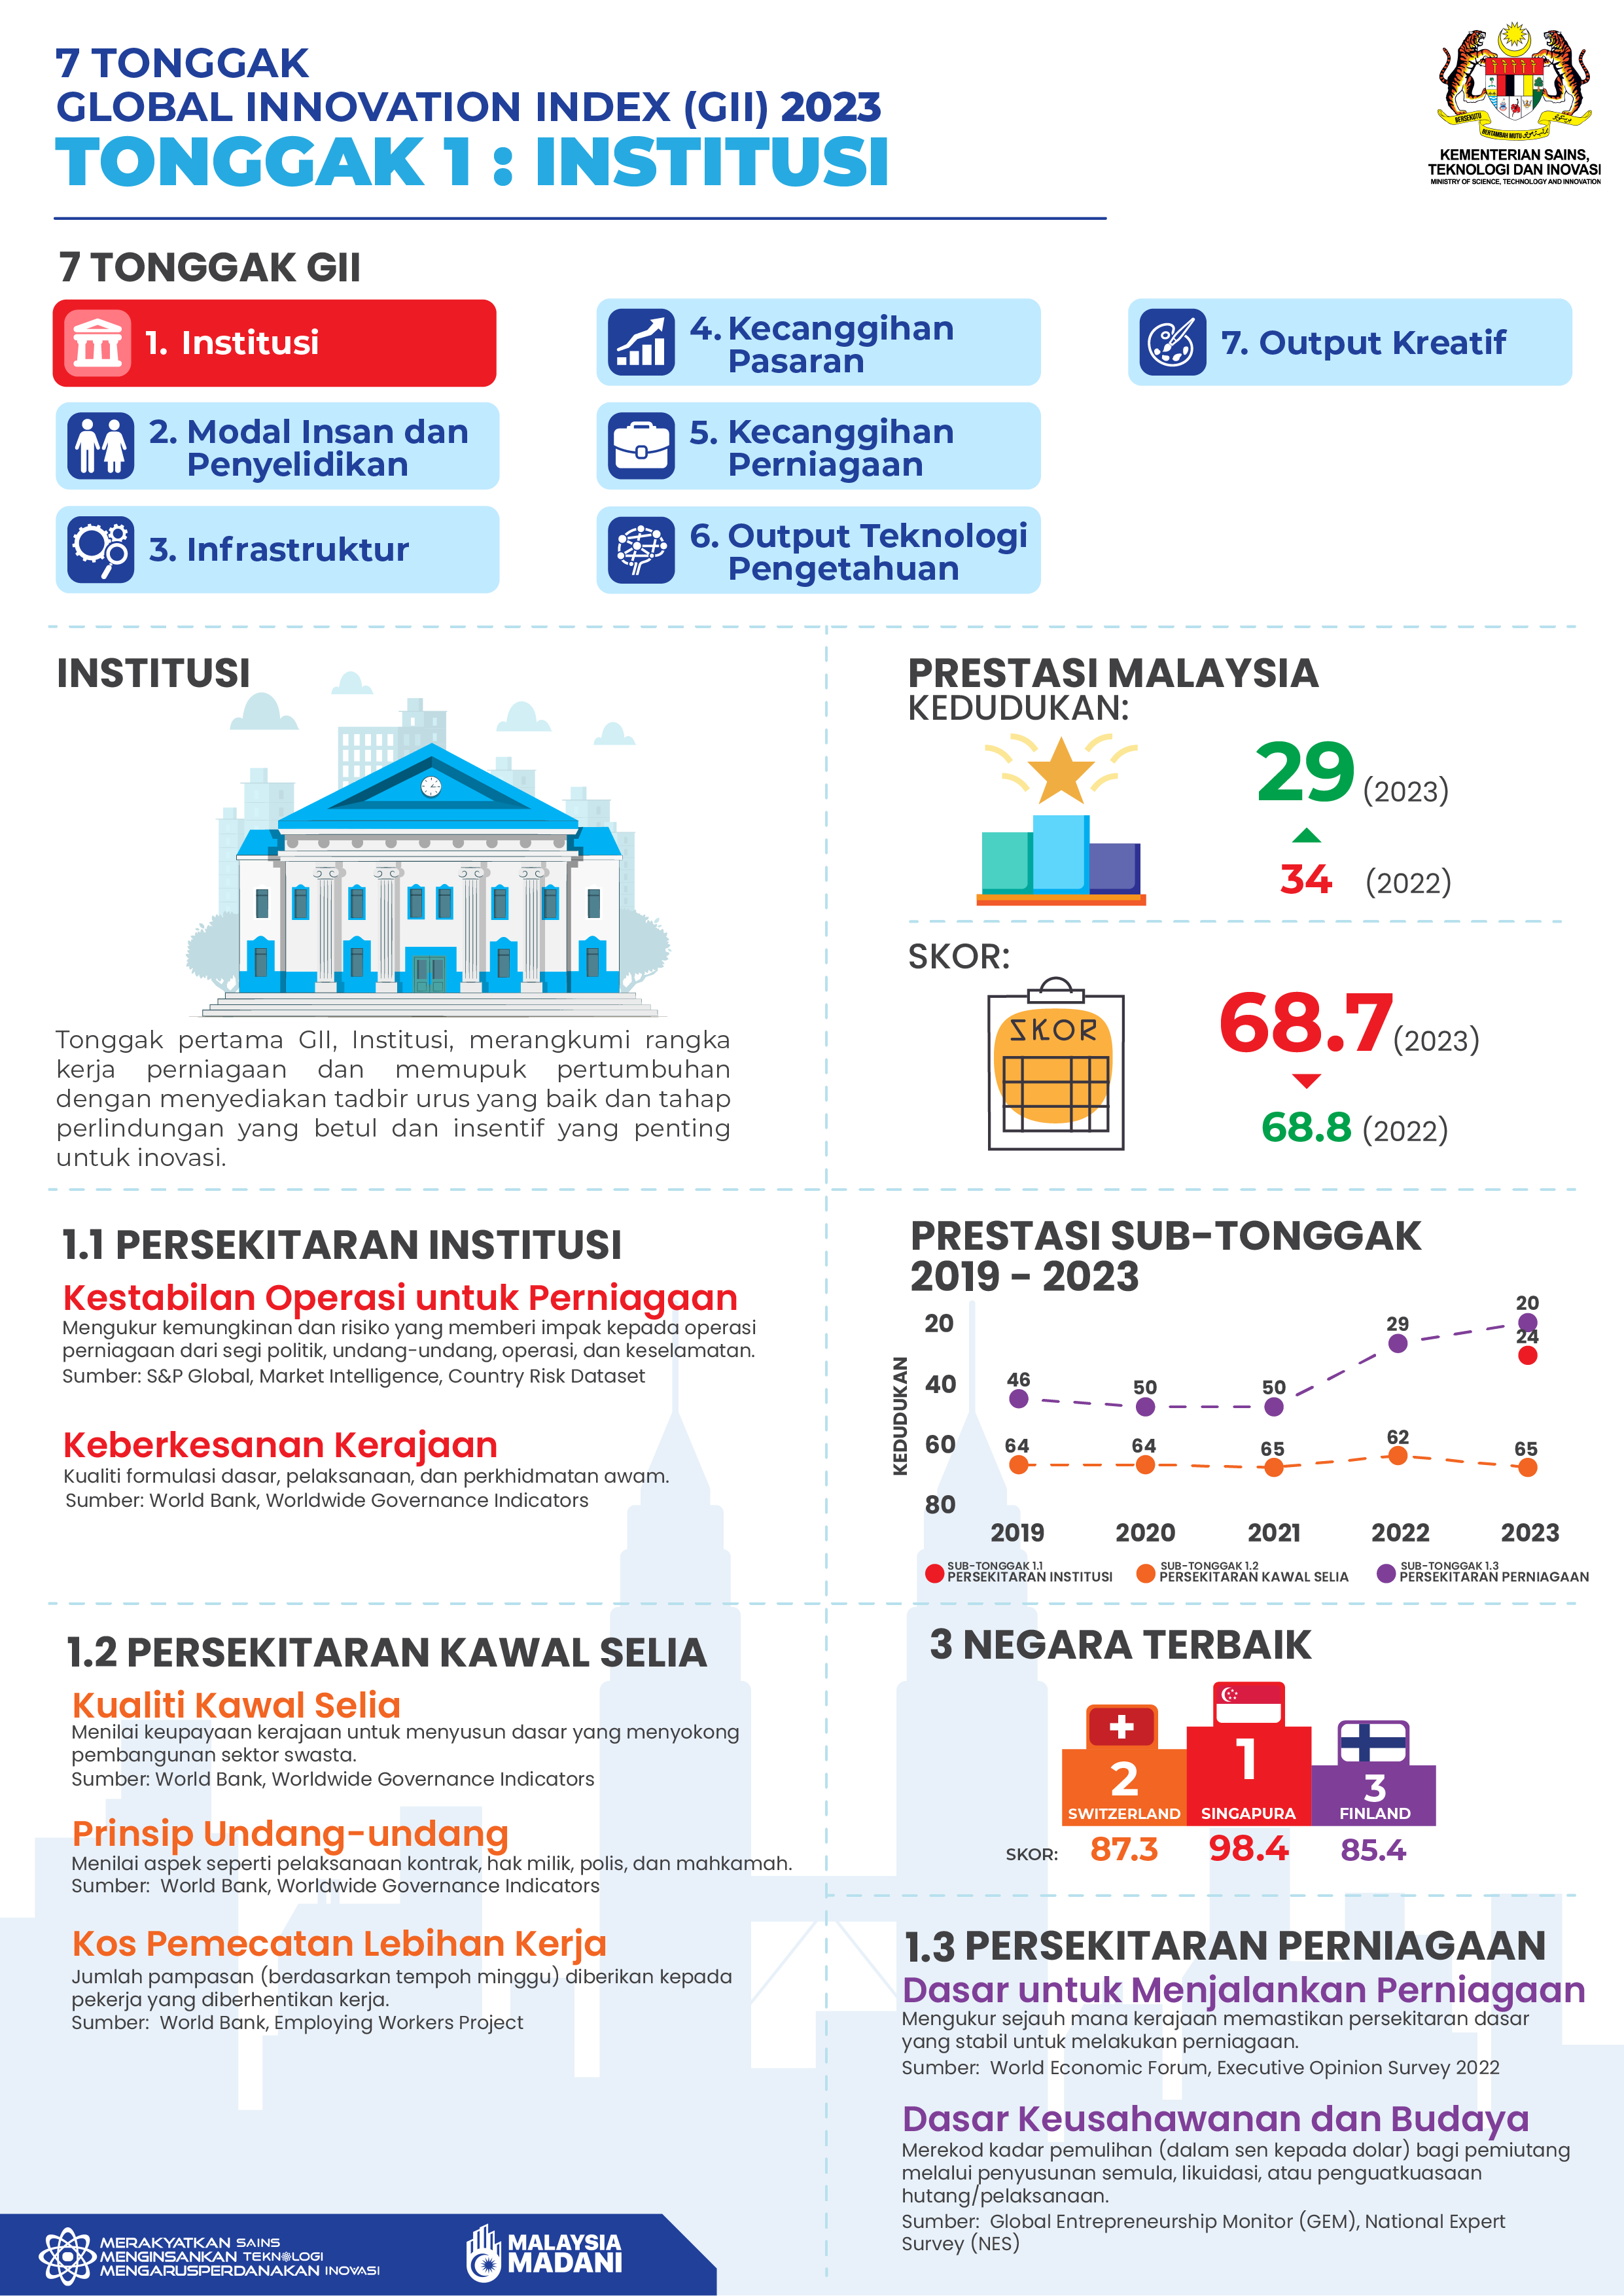
Institutions
It evaluates the quality and effectiveness of various institutions within a country's innovation ecosystem that play a crucial role in fostering and supporting innovation. It is designed to measure the enabling environment for innovation within a nation. Assessing the state of institutions within a country allows the GII to gauge the overall environment for innovation and identify areas where improvements or policy changes can enhance the innovation ecosystem and promote economic growth and development.
Sub-Pillars:
- Political environment
- Regulatory environment
- Business environment
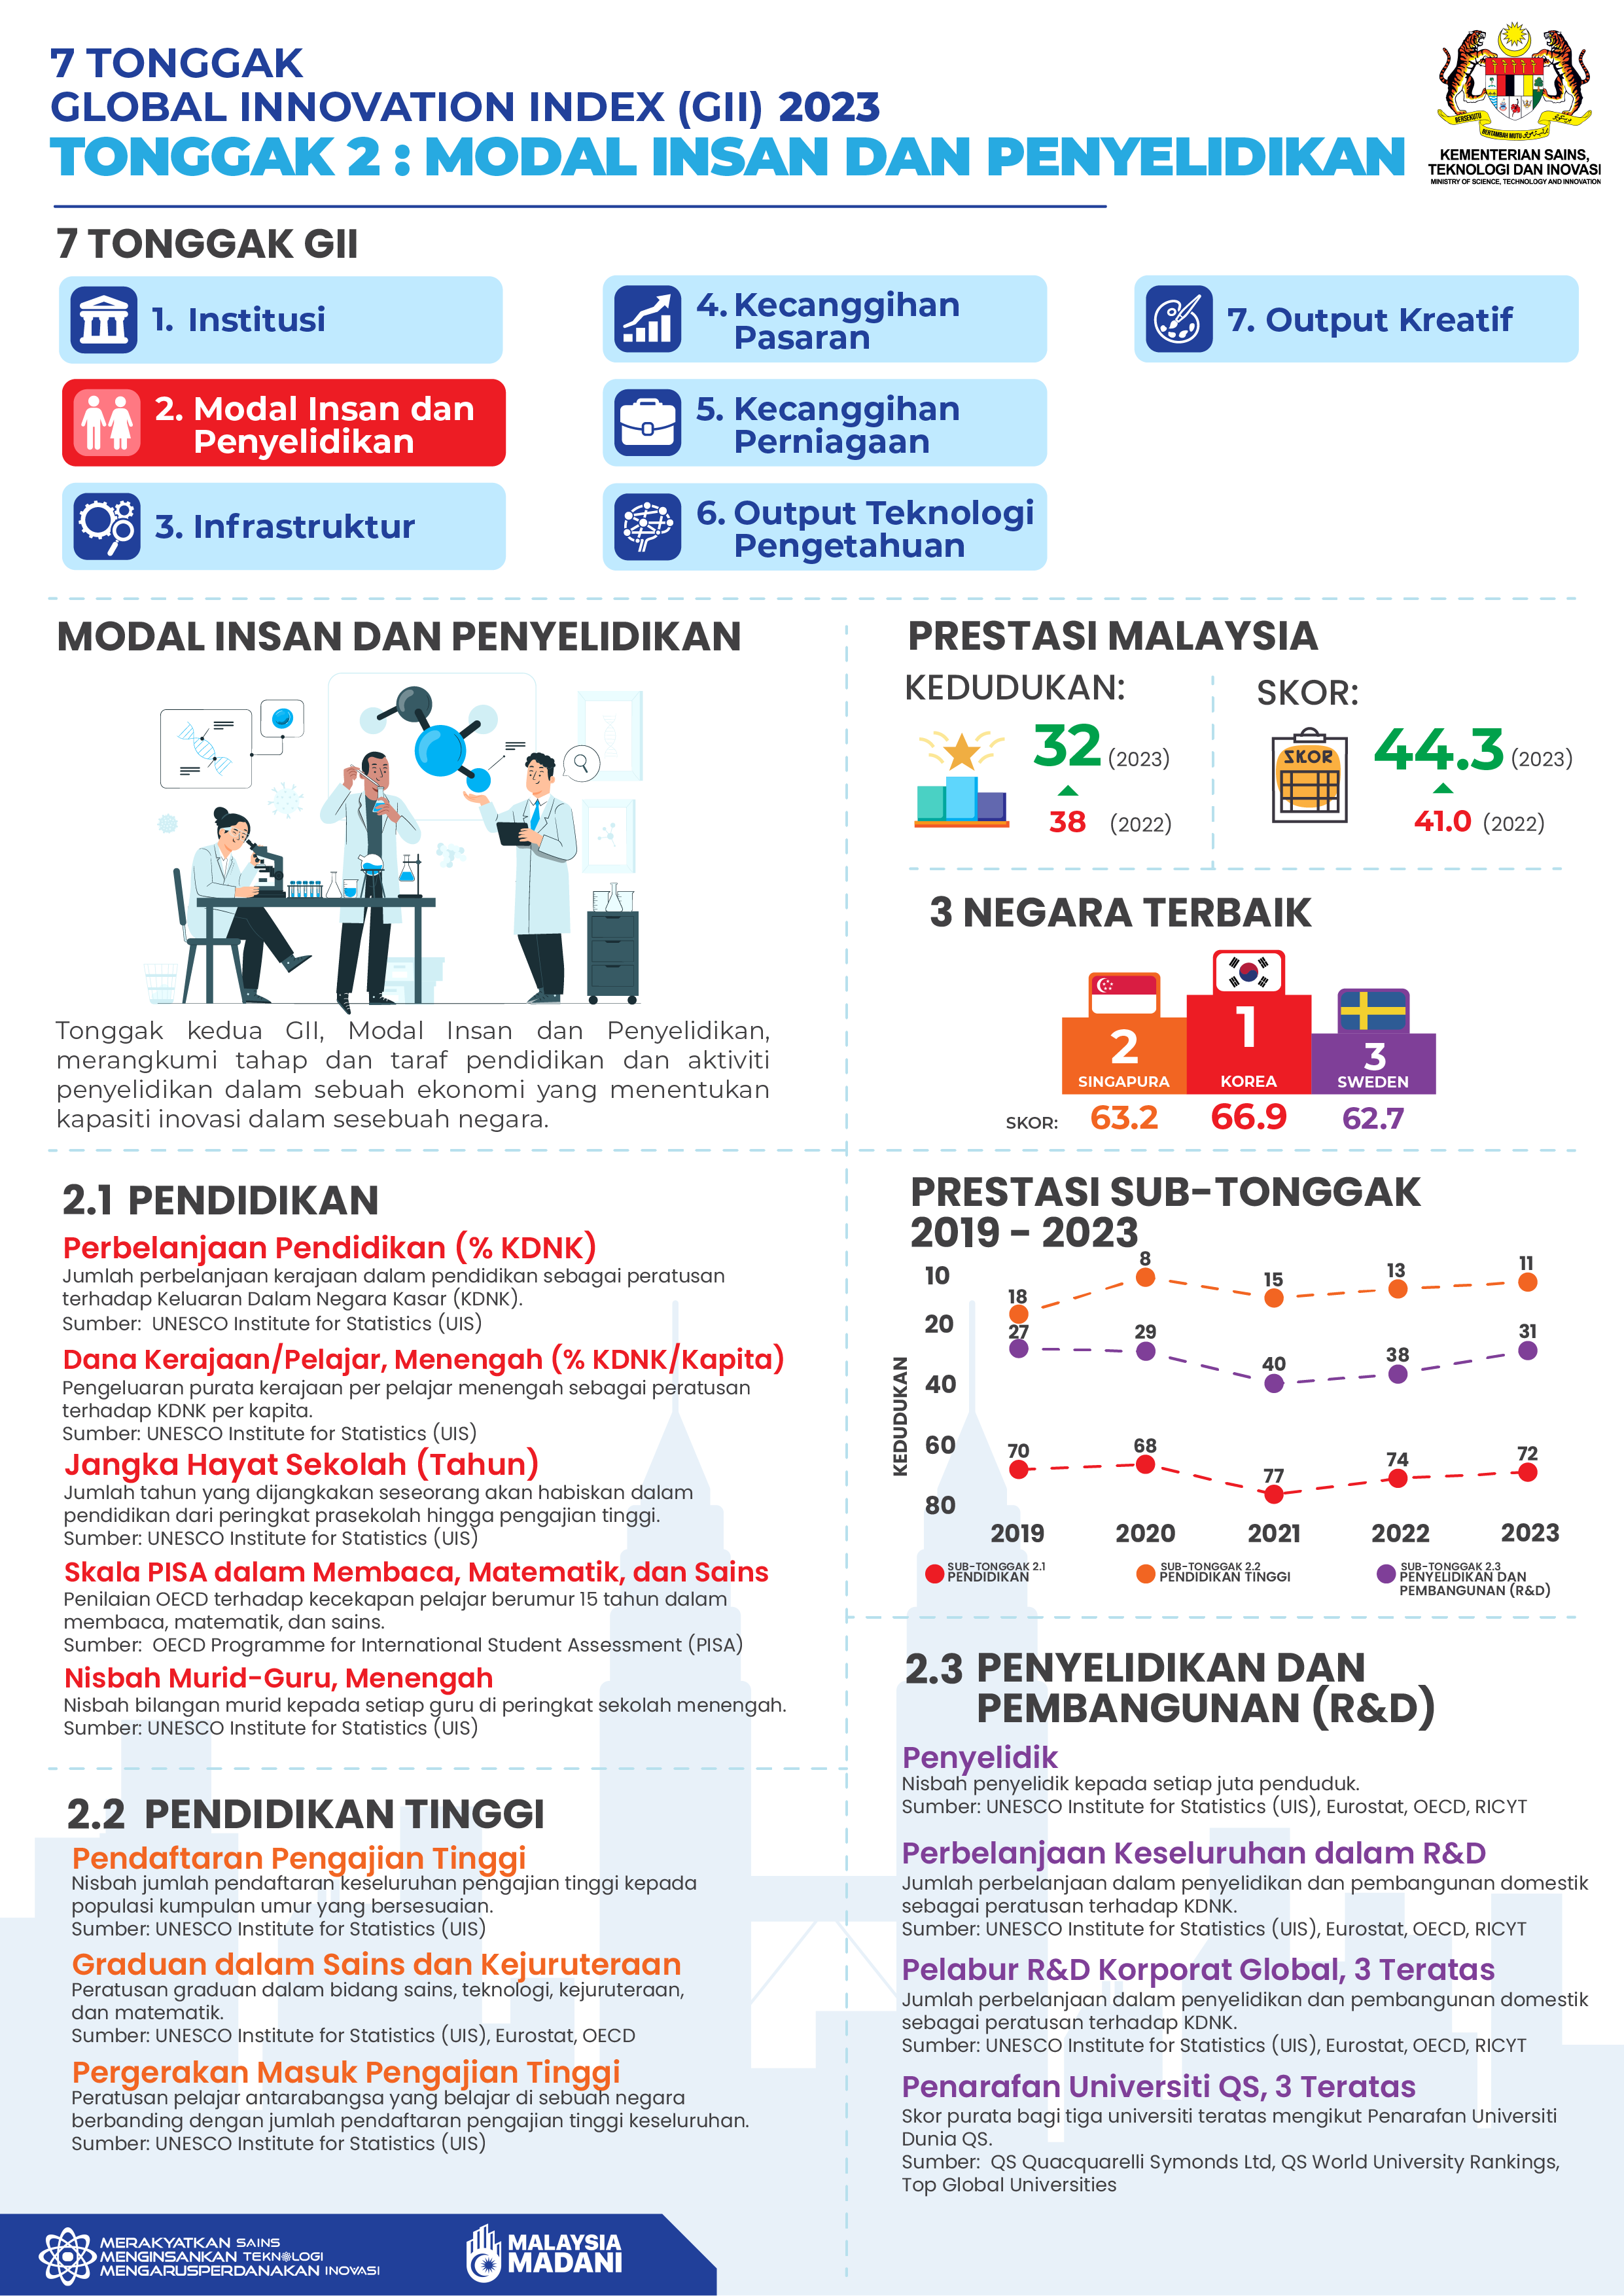
Human capital and research
This pillar evaluates the availability and quality of human capital, as well as the research and development (R&D) activities within a nation. By evaluating the state of human capital and research within a country, the GII can provide insights into the country's capacity to innovate, the effectiveness of its educational systems, and the extent of its research and development activities. This information is essential for policymakers, businesses, and institutions in identifying strengths and weaknesses in the innovation ecosystem and formulating strategies to foster innovation and drive economic growth and competitiveness
Sub-Pillars:
- Education
- Tertiary education
- Research and development (R&D)
Infrastructure
This pillar evaluates the quality and effectiveness of infrastructure, both physical and digital, within a nation, as these factors play a critical role in supporting innovation and economic development. By assessing the state of infrastructure within a country, the GII provides valuable insights into its capacity to support innovation and create an enabling environment for businesses, entrepreneurs, and researchers to thrive. Strong and reliable infrastructure can enhance connectivity, facilitate knowledge sharing, attract investments, and ultimately contribute to a more innovative and competitive economy.
Sub-Pillars:
- Information and communication technologies (ICTs)
- General infrastructure
- Ecological sustainability
Market sophistication
This pillar evaluates the level of market sophistication and the effectiveness of market mechanisms in supporting innovation-driven activities and economic growth. By evaluating the level of market sophistication within a country, the GII provides insights into the country's readiness to adopt and absorb innovative technologies and solutions. A sophisticated market environment with skilled workers, supportive business conditions, and ample funding opportunities can stimulate innovation, attract investments, and foster a thriving ecosystem of innovation-driven enterprises.
Sub-Pillars:
- Credit
- Investment
- Trade, diversification, and market scale
Business sophistication
This pillar evaluates the sophistication of business activities and practices within a nation, with a focus on aspects that support innovation and entrepreneurship. By assessing the level of business sophistication within a country, the GII provides insights into the innovation readiness and capabilities of businesses. A sophisticated business environment that encourages R&D investments, fosters creativity, and supports entrepreneurship can stimulate innovation-driven growth, foster competitiveness, and contribute to the overall development of a knowledge-based economy.
Sub-Pillars:
- Knowledge workers
- Innovation linkages
- Knowledge absorption
Knowledge and technology outputs
This pillar evaluates the tangible outcomes of a country's innovation efforts and the knowledge-intensive activities that contribute to technological advancement and economic growth. By assessing the knowledge and technology outputs of a country, the GII provides insights into the impact and effectiveness of its innovation ecosystem. A strong performance in this pillar demonstrates a country's ability to generate new knowledge, technological solutions, and intellectual property, which are essential drivers of economic competitiveness and sustainable growth. Additionally, a country's capacity to contribute to the global knowledge pool and attract international recognition further enhances its status as an innovative and dynamic player in the global economy.
Sub-Pillars:
- Knowledge creation
- Knowledge impact
- Knowledge diffusion
Creative outputs
This pillar evaluates the creative aspects of a country's innovation ecosystem, focusing on the generation and utilization of creative products and outputs. By assessing the creative outputs of a country, the GII provides insights into its ability to foster and capitalize on creativity as a driver of innovation and economic development. A strong performance in this pillar indicates a vibrant creative sector, the capacity to produce and market cultural and creative products, and the potential to leverage creative assets for economic growth and cultural enrichment. Emphasizing creative outputs can contribute to the overall innovation ecosystem and enhance a country's competitiveness in the global creative economy.
Sub-Pillars:
- Intangible assets
- Creative goods and services
- Online creativity
Source : MIGHT Malaysia
Source : MASTIC Portal
Instagram:Ada Apa Dengan GII?
GII Data Analysis
Advance Analysis is used to access detailed reports on the analysis of pillars, sub-pillars, and indicators, performance of indicators compared to the previous year, and headroom availability for… Read More
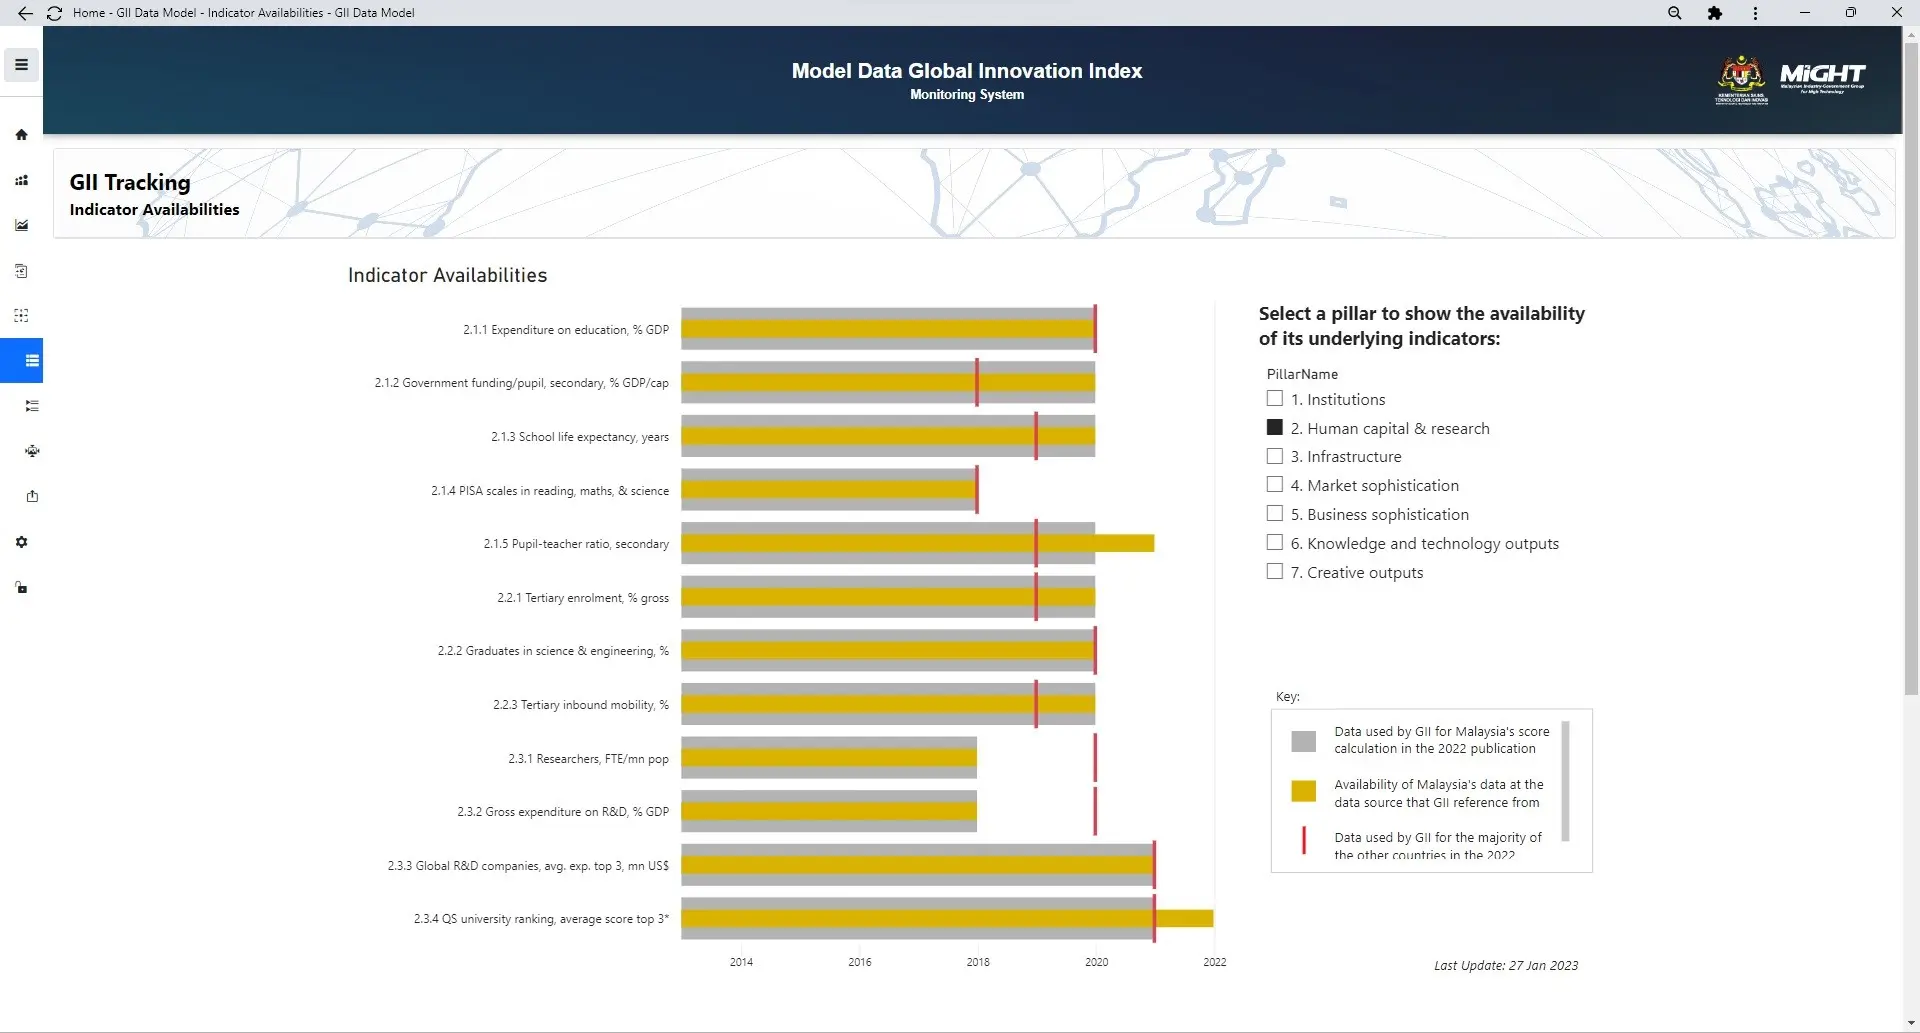
GII Indicator Data Availabilities
Module Tracking is a module for storing information regarding the availability years for each GII indicator of Malaysia and the years utilized by other countries. This module is intended to track… Read More
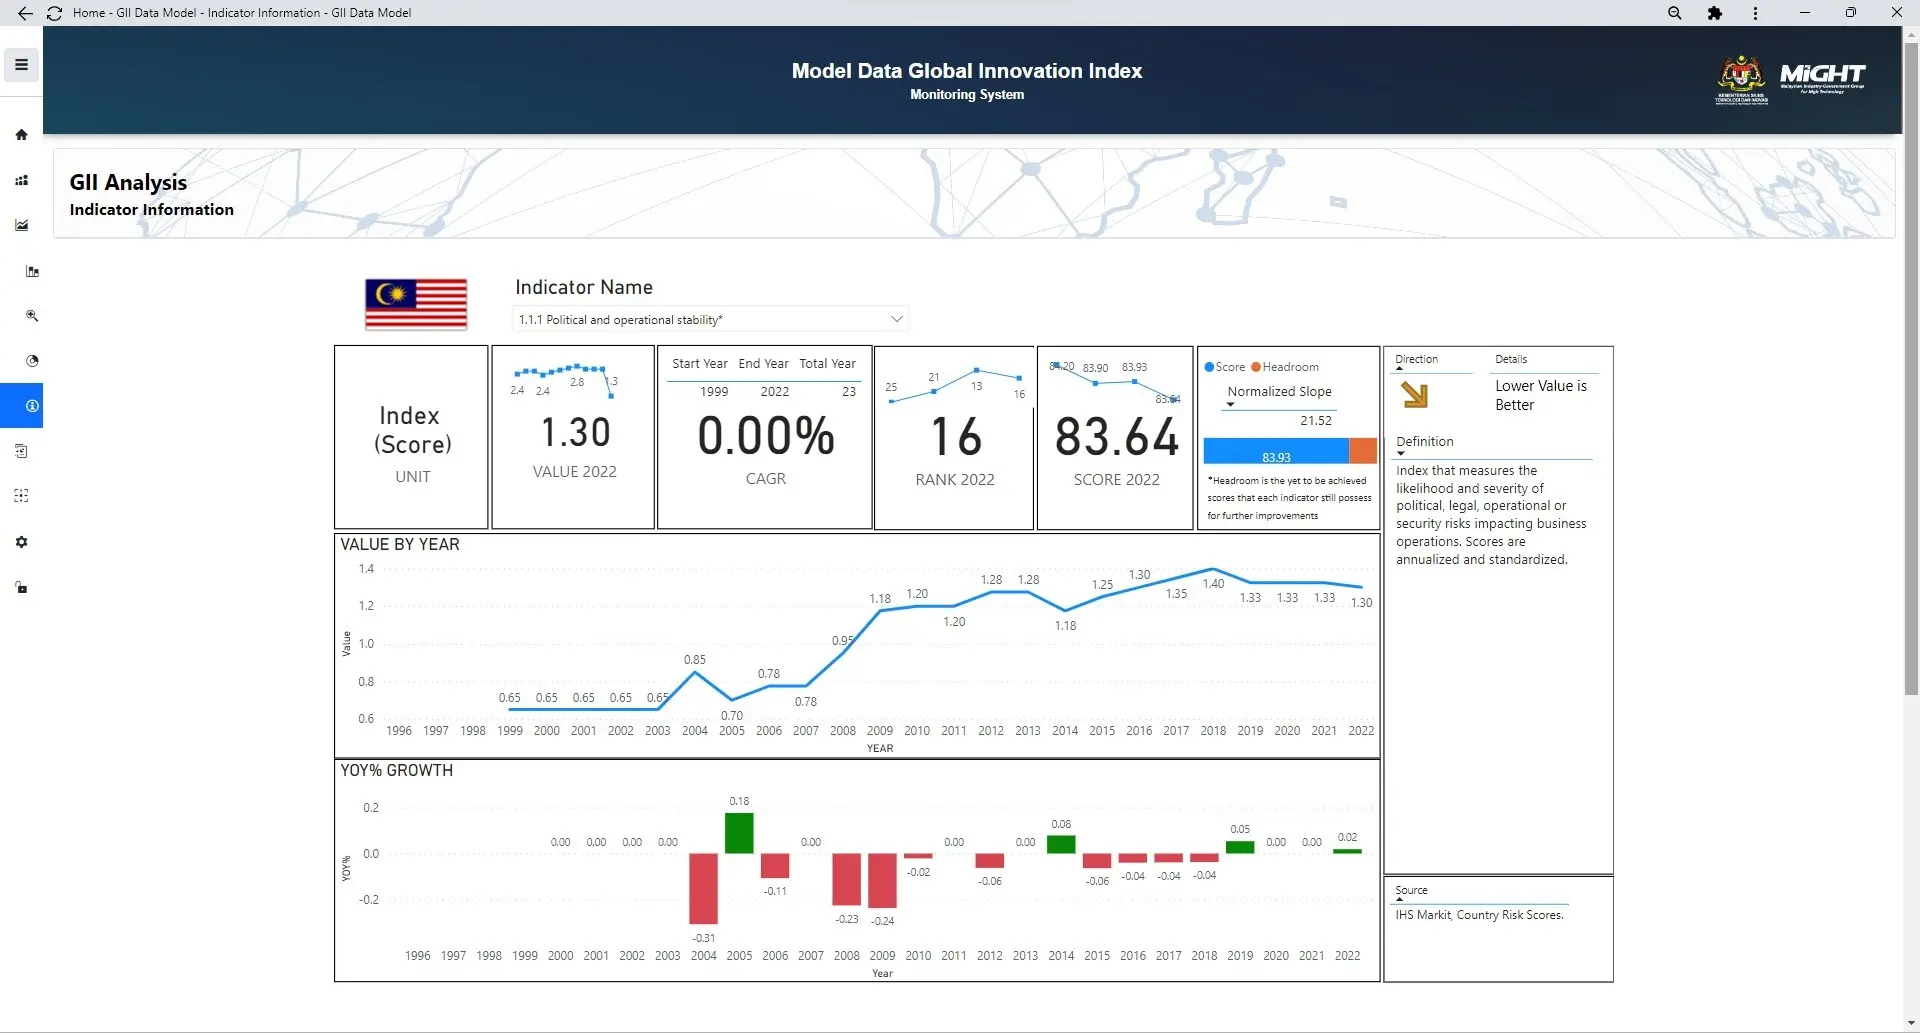
GII Indicator information
This module enables registered users to access detailed reports for each indicator, such as data trends, rankings, and scores for the latest year, normalized slope, available headroom, and also… Read More
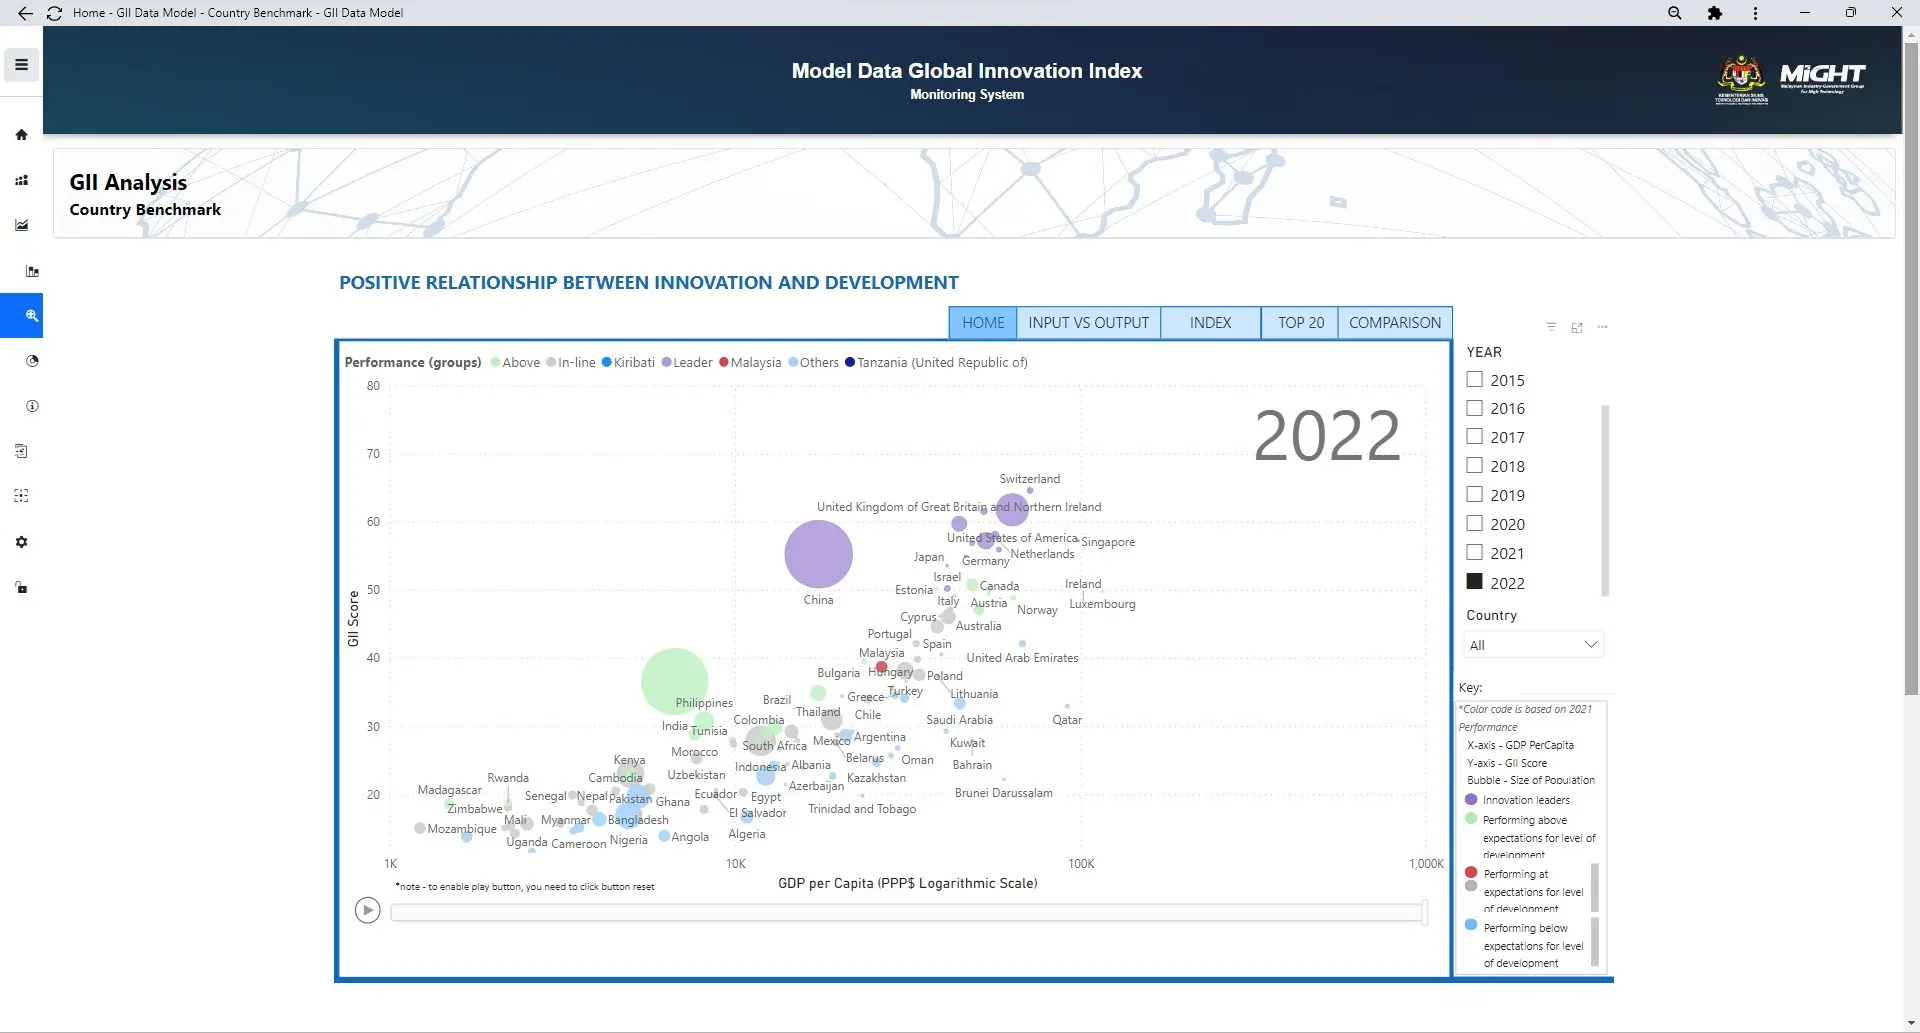
GII Country Benchmark
This module is intended to display data through visualization, making it easier for users to understand the presented statistics/information. This model allows users to access reports on Malaysia'… Read More
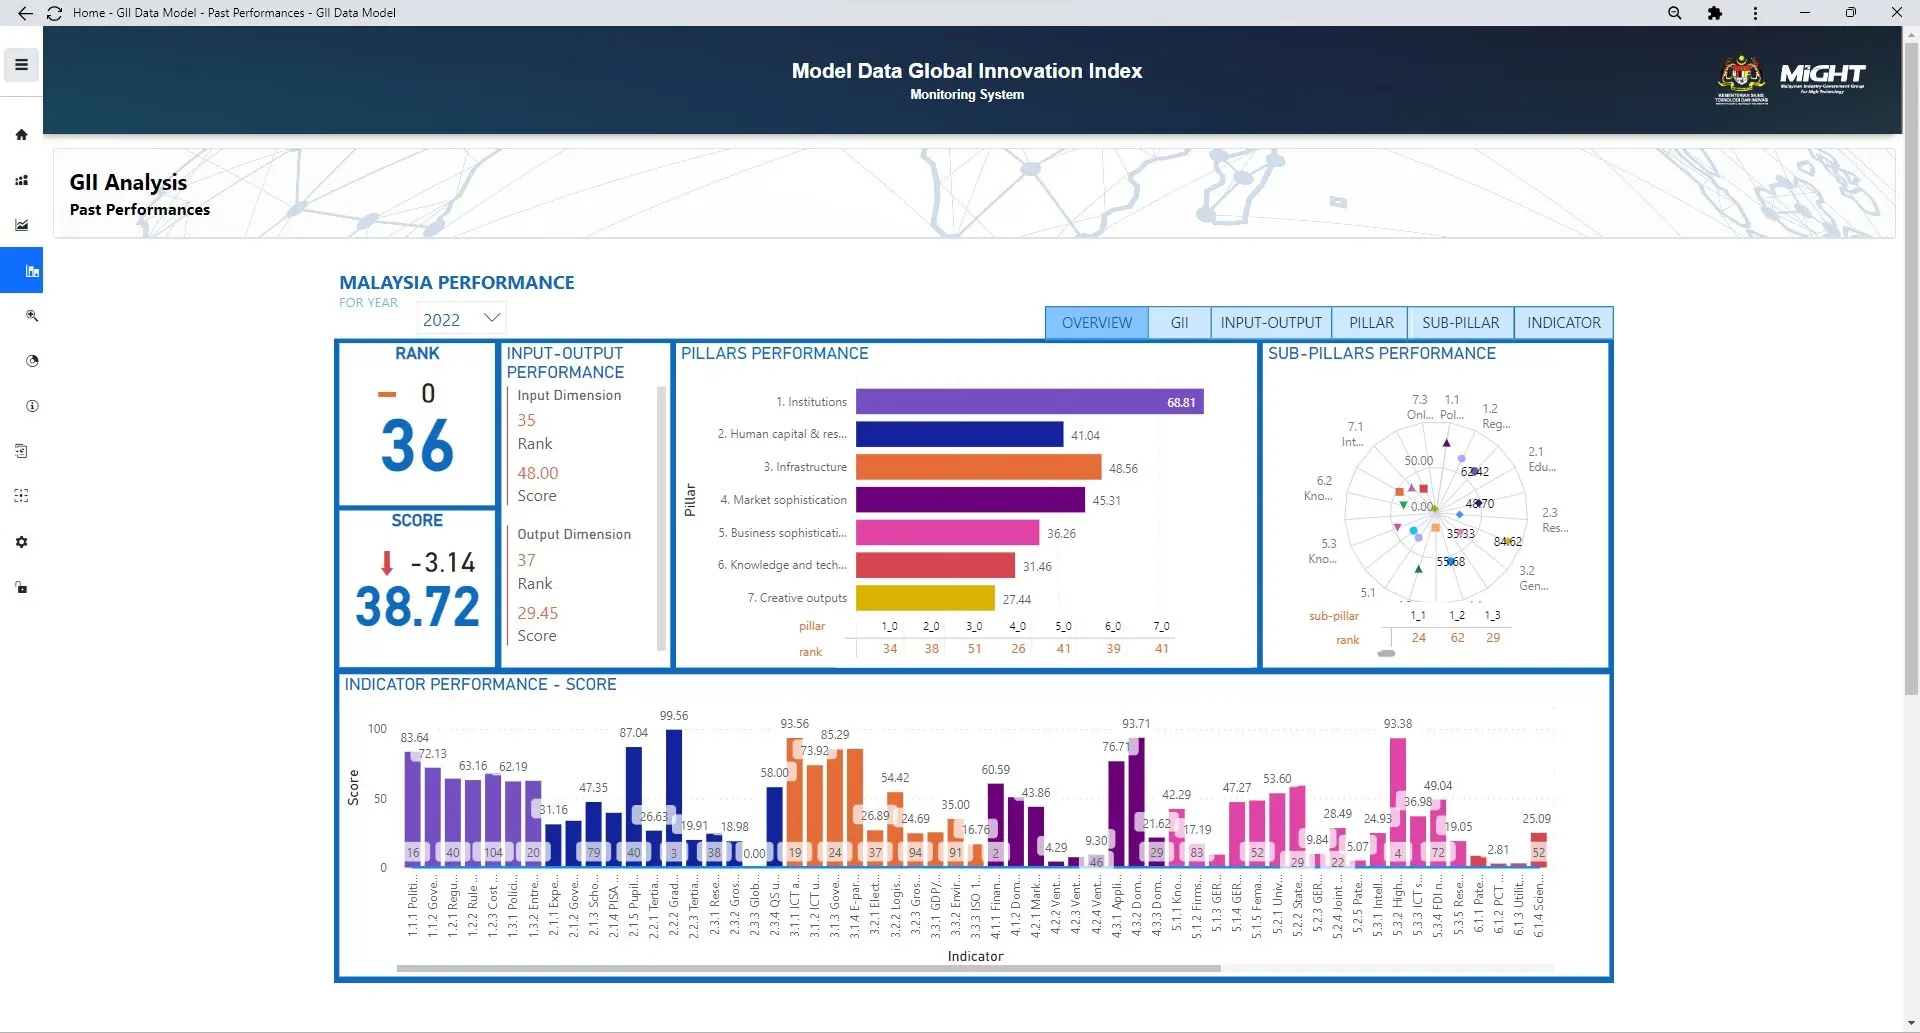
GII Past Performances
Module Tracking is a module for storing information regarding the availability years for each GII indicator of Malaysia and the years utilized by other countries. This module is intended to track… Read More
Source : Sistem Model Data GII
The objective of establishing JIPGII:
- To implement and enhance the monitoring of competitiveness indices in a more systematic and effective manner to improve the country's performance in the Global Innovation Index (GII) report;
- To ensure the accuracy and timely collection, storage, and updating of indicators by data custodians in the international database, thereby showcasing the actual achievements of the country; and
- To identify short-term, mid-term, and long-term targets to improve scores and elevate Malaysia's position in the GII report.
3 PHASE: REALISING MALAYSIA’S ASPIRATION IN GII
Implementation phase and current status
PHASE 1a: MAPPING MALAYSIA'S STATE OF INNOVATION (√ DONE)
Objective: Establishing Malaysia's innovation ecosystem with its source and contribution of data to ensure comprehensiveness, accuracy and timeliness.
 PHASE 1b: COMMUNICATION MALAYSIA'S STATE OF INNOVATION (√ DONE)
Objective:
- Coordinating the relay of data information required for GII indicators in a timely manner by National data custodians to the respective international databases and
- Informing National Stakeholders on Malaysia's innovation strategies, initiatives and performance.
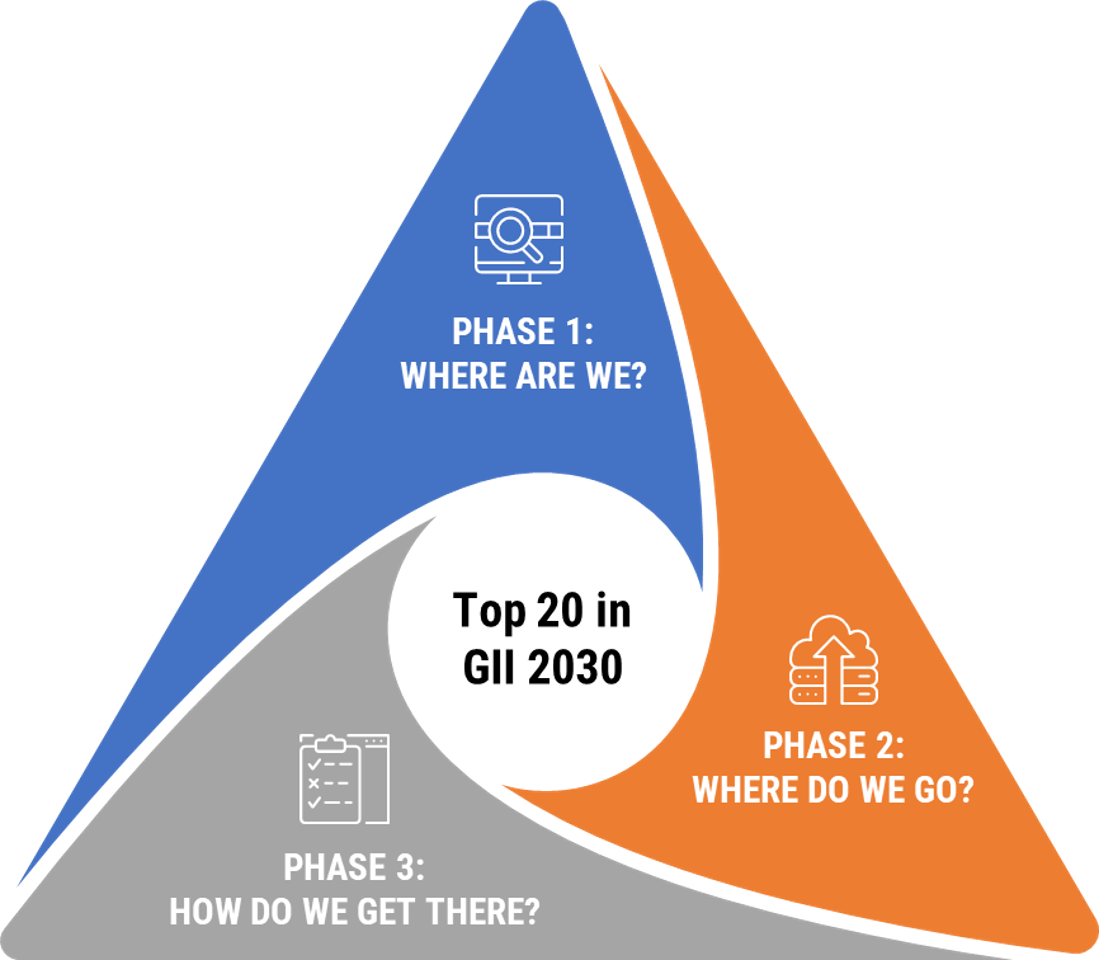
PHASE 2: ASPIRING FOR MALAYSIA'S STATE OF INNOVATION (√ DONE)
Objective:
- Benchmarking against global best practices of the GII and
- Setting the targets for Malaysia's aspiration in GII.
(Currently we are at this stage!)
PHASE 3a: MONITORING MALAYSIA'S STATE OF INNOVATION
Objective:
- Ensuring the strategies and initiatives are on track and recommending and
- Updating annual data of the GII indicators.
PHASE 3b: IMPROVING MALAYSIA'S STATE OF INNOVATION
Objective: Identifying short, mid and long-term strategies and implementing initiatives towards improving Malaysia's GII scores and ranking.
Pillar Lead: MRANTI
Ministries
- NRECC
- KKD
- MOT
- MOF
Agencies
- MCMC
- DOSM
- MAMPU
- MDEC
- JSM
- ST
Pillar Lead: MTDC
Ministries
- -
Agencies
- BNM
- BURSA MALAYSIA
- SECCOM
Pillar Lead: Cradle
Ministries
- MOHR
- MOHE
- MOF
- MITI
- MOSTI
- MASTIC
- Bhg. DANA
Agencies
- MIDA
- ASM
- MyIPO
- DOSM
- MPC
- BNM
- JPK
- MDEC
Pillar Lead: MyIPO
Ministries
- MOHE
- MITI
- MOF
- MOSTI
- Bhg. PTK
Agencies
- DOSM
- JSM
- MCMC
- PSM
- MRANTI
Pillar Lead: MIMOS
Ministries
- KKD
Agencies
- MATRADE
- MAMPU
- MyIPO
- MPC
- MYNIC
- DOSM


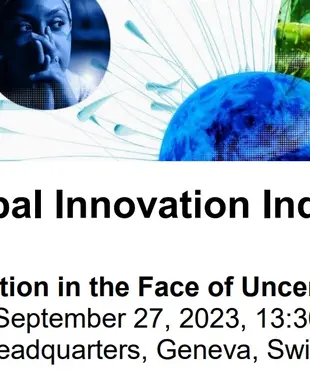
The Global Innovation Index 2023 (GII) takes the pulse of innovation against a background of an economic and geopolitical environment fraught with…
16thed.: 2023
New Ed. (Released on 27 Sept 2023)
Global Innovation Index 2022 (GII) tracks global innovation trends against the background of an ongoing COVID-19 pandemic, slowing productivity…
15thed.: 2022
(Released on 27 Sept 2022)
The Global Innovation Index 2021 takes the pulse of the most recent global innovation trends and ranks the innovation ecosystem performance of 132…
14th ed.: 2021
The Global Innovation Index 2020 provides detailed metrics about the innovation performance of 131 countries and economies around the world.
13th ed.: 2020
The Global Innovation Index 2019 provides detailed metrics about the innovation performance of 129 countries and economies around the world.
12th ed.: 2019
The Global Innovation Index 2018 provides detailed metrics about the innovation performance of 126 countries and economies around the world.
11th ed.: 2018
Hi! Im MYGII
MASTIC

Administrator
Noor Fairuz Shamsudin
03-8885 8110
noorfairuz@mosti.gov.my

Administrator
Rudy Nurdin
03-8885 8652
rudy@mosti.gov.my
Pillar 1
Institution
Malaysia Productivity Corporation
Ilyana Norsaidah
Person In Charge
illyana@mpc.gov.my
03 - 7955 7266
Pillar 2
Human Capital & Research
Akademi Sains Malaysia
Teng Yu He
Person In Charge
teng@akademisains.gov.my
03 - 6203 0633
Pillar 3
Infrastructure
Malaysian Research Accelerator for Technology & Innovation
Nur Aliya Ayob
Person In Charge
aliya@mranti.my
03 - 8998 2020
Pillar 4
Market Sophistication
Malaysia Technology Development Corporation
Nor Halina Ghazali
Person In Charge
halina@mtdc.com.my
03 - 2172 6000
Pillar 5
Business Sophistication
Cradle Fund Sdn. Bhd.
Sitti Nursaadah Md Rusli
Person In Charge
sitti@cradle.com.my
03 - 4045 8600
Pillar 6
Knowledge & Technology Outputs
Intellectual Property Corporation of Malaysia
Meriam Nur Ahmad Hanbali
Person In Charge
meriam@myipo.gov.my
03 - 2299 8961
Pillar 7
Creative Outputs
Malaysian Institute of Microelectronic Systems
Siti Affida Zamry
Person In Charge
affida@mimos.my
03 - 8995 5000