

The 2023 Global Innovation Index
Who leads on unicorns?
The 2023 Global Innovation Index (GII) introduces a new indicator: 6.2.2 Unicorn valuation, % GDP that assesses the combined valuation of unicorn companies, which are privately held startups valued at over USD 1 billion. These unicorns are known for their rapid growth and disruptive innovations that can reshape entire industries. As of April 2023, there were 1,206 unicorn companies across 50 countries worldwide.
Key findings from the GII report regarding unicorn companies include:
1. Global Distribution: Unicorn companies are primarily concentrated in five economies, with the United States hosting 54% of them, followed by China (14%), India (6%), the United Kingdom (4%), and Germany (2%). The total valuation of unicorn companies globally in 2023 reached USD 3.8 trillion, with US unicorns accounting for USD 2 trillion, followed by China at USD 736 billion and India at USD 193 billion.
2. Top Valuable Unicorns: Among the top 25 most valuable unicorn companies, China leads with ByteDance (1st in artificial intelligence), SHEIN (3rd in e-commerce), and Xiaohongshu (12th in e-commerce). The United States follows with SpaceX (2nd in space and telecommunications), Stripe (4th in fintech), and Epic Games (7th in video games). Other countries like Australia and Indonesia also have notable unicorn companies.
3. Scaling by GDP: The GII scales the cumulative value of unicorns by GDP to assess the unicorn ecosystem’s relative strength in different economies. Five economies, namely Estonia, Israel, Lithuania, Senegal, and the United States, tie for the top position after scaling. These countries are home to unicorns like Bolt, Wiz, Vinted, and Wave, operating in various sectors.
4. Unicorns and Development: Analyzing the relationship between an economy’s level of development and the cumulative value of its unicorn companies reveals that most high-income economies fall in the upper-right quadrant. However, there are also high-income European economies with a lower concentration of unicorn companies in the lower-right quadrant.
In summary, the GII report highlights the prevalence and economic significance of unicorn companies globally, with a focus on their concentration in a few leading economies and their impact on innovation and economic development.
Unicorn valuation by level of economic development, 2023
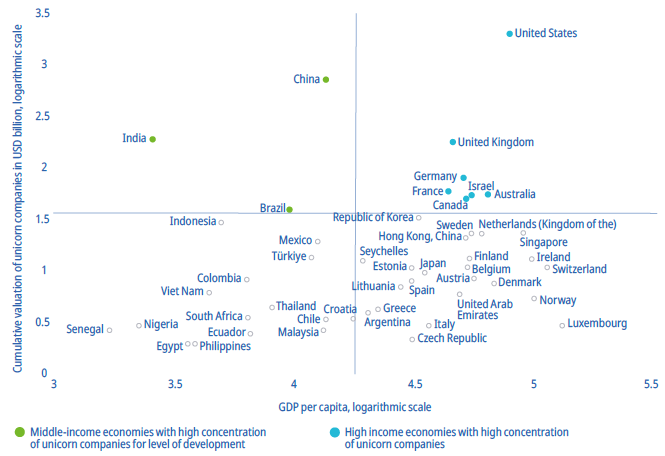
Source : Authors, based on CBInsights, 2023 and IMF World Economic Outlook, April 2023.
The left-hand quadrants in the analysis of unicorn companies in relation to economic development reveal some intriguing cases:
1. Upper-Left Quadrant: This quadrant includes middle-income economies like China, India, and Brazil. These countries stand out as they have a high concentration of unicorn companies relative to their level of development. It indicates that they are fostering a vibrant ecosystem of innovative startups, despite not being high-income nations.
2. Lower-Left Quadrant: In this quadrant, you find middle- and low-income economies that host unicorn companies, even though their valuations might be comparatively lower. Notably, Latin American economies feature prominently in this category, including Argentina, Chile, Colombia, Ecuador, and Mexico. Some of the leading unicorns from this region include Kavak (Mexico, e-commerce), Rappi (Colombia, supply chain), and Uala (Argentina, fintech).
These findings underscore the dynamic and diverse landscape of unicorn companies worldwide, with some emerging economies punching above their weight in nurturing innovative startups, particularly in Latin America
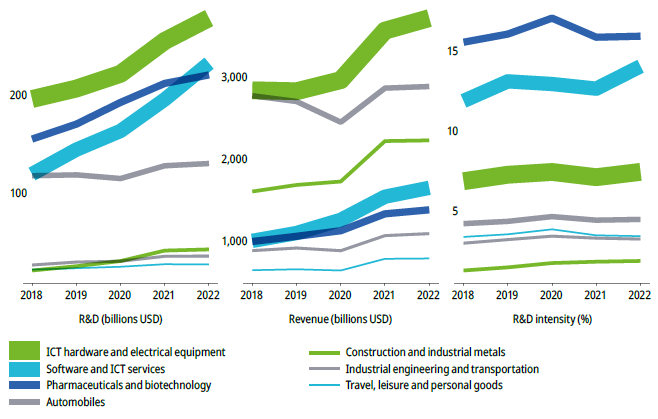
Source : WIPO, based on BvD Orbis database
In 2022, the United Kingdom witnessed a decline in the number of companies increasing their R&D budgets compared to the exceptional year of 2021, with one notable exception being the travel, leisure, and personal goods sector, where more firms increased their R&D spending. Pharma led the R&D intensity ranking in 2022 at 15.9 percent, followed closely by software and ICT services at 14.1 percent, significantly ahead of ICT hardware at 7.4 percent and automobiles at 4.5 percent. Among the top 15 firms in the top seven industries, most increased their R&D expenditures in 2022, except for pharmaceuticals, industrial engineering, and transportation. The ICT hardware sector saw impressive R&D growth, led by Nvidia, SK Hynix, and Mediatek. In software and ICT services, Meta and Uber showed substantial R&D growth, while the automobile sector also displayed positive trends, with General Motors, Volkswagen, and Robert Bosch leading in expenditure. Additionally, the travel, leisure, and personal goods sector saw notable R&D spending growth, with companies like Roblox, Unity Software, and Airbnb making strides.
Top 10: Science and Technology Clusters – Global Innovation Index 2022
Source : www.wipo.int
The Global Innovation Index’s Science and Technology (S&T) Cluster ranking identifies regions with concentrated science and technology activity. These clusters are determined by analyzing patent filings and scientific publications to locate areas with a high density of inventors and authors.
WIPO locates and ranks science and technology clusters through a geocoding method, mapping addresses and names pulled from documents to 96% accuracy. Find out more about the S&T Cluster methodology.
The top five S&T clusters in the world are all in East Asia, with Tokyo-Yokohama (Japan) leading, followed by Shenzhen-Hong Kong-Guangzhou (China and Hong Kong), Seoul (Republic of Korea), Beijing (China), and Shanghai-Suzhou (China).
The United Kingdom’s Cambridge cluster and San Jose-San Francisco in the United States exhibit the most intensive S&T activity relative to population density, followed by Oxford (UK), Eindhoven (Netherlands), and Boston-Cambridge (US).
China has the most S&T clusters, with 24 identified this year, followed by the US with 21, Germany with 9, and Japan, Canada, India, and the Republic of Korea each having 4. Notable clusters include San Jose-San Francisco (US), Munich (Germany), Tokyo-Yokohama (Japan), Toronto (Canada), Bengaluru (India), and Seoul (Republic of Korea).
Middle-income economies like India also experienced significant growth in S&T clusters, particularly in Chennai and Bengaluru. Emerging economies such as Brazil, India, Türkiye, Argentina, Egypt, and Thailand witnessed rapid growth in their S&T clusters.
Overview – Global Innovation Index (GII) 2022
Source : www.wipo.int
The Global Innovation Index (GII) report for this year provides valuable insights into the evolving global innovation landscape, which is influenced by factors like the ongoing pandemic, geopolitical shifts, and economic recovery. It’s important to note that some of the changes in GII rankings this year may be influenced by short-term trends rather than long-term shifts. Key takeaways from the report include:
1. Shifts Among Top 20 Innovators: Notable changes have occurred among the top 20 innovating countries. Sweden, Singapore, Finland, Denmark, France, and Israel have moved up the rankings, with a strong performance by Nordic and Baltic nations.
2. Mixed Picture for Emerging Economies: Leading emerging economies display a mixed performance. Indonesia has seen rapid growth, the Philippines and Vietnam are progressing, while India remains stable. However, China, Turkey, and Iran have experienced slight declines, possibly due to COVID-19 effects.
3. Consistent Overperformance: India, the Republic of Moldova, and Vietnam have consistently outperformed in innovation relative to their development levels for 13 years. Indonesia, Uzbekistan, and Pakistan have maintained their overperformer status, with Brazil overperforming for three consecutive years.
4. Positive Developments in the Middle East: The Middle East shows positive innovation ranking developments, with the United Arab Emirates (UAE) nearing the top 30. Saudi Arabia, Qatar, Bahrain, Oman, and neighboring countries are making progress.
5. African Innovation Leaders: Mauritius and South Africa lead innovation in Sub-Saharan Africa, with strong positions in the GII’s top 60. Five economies in the region are overperforming in innovation, with Rwanda consistently doing so.
6. Need for Systematic Improvement: Many middle- and low-income economies could benefit from systematic and gradual improvements to their innovation ecosystems. Addressing challenges like pandemic impacts, limited risk capital, high interest rates, debt levels, and supply chain disruptions is crucial.
7. Monitoring and Preservation: Continuous monitoring of innovation trends is essential, especially in the context of sustainable development goals (SDGs). It is crucial to preserve the positive changes achieved in innovation systems and policies over the past two decades.
8. Future GII Reports: Future editions of the GII will closely track developments and their long-term impacts. This ongoing effort aims to enhance our understanding of innovation and its measurement, distinguishing between transient and enduring changes in country and regional performance.
In summary, the GII report highlights the dynamic nature of global innovation, influenced by a range of factors. While some changes may be temporary, ongoing monitoring and policy adjustments are critical to maintaining and enhancing innovation ecosystems worldwide.
#WIPO #GlobalInnovationIndex #GII2023 #Innovation